Food Photography
Photoworld Maps The Food Capitals Of The World Using Instagram Hashtags
Snapping pictures of food and uploading them to Instagram is a popular activity. Hashtag a pic of those delicious pancakes and voila! Other pancake fanatics will herd around the picture.
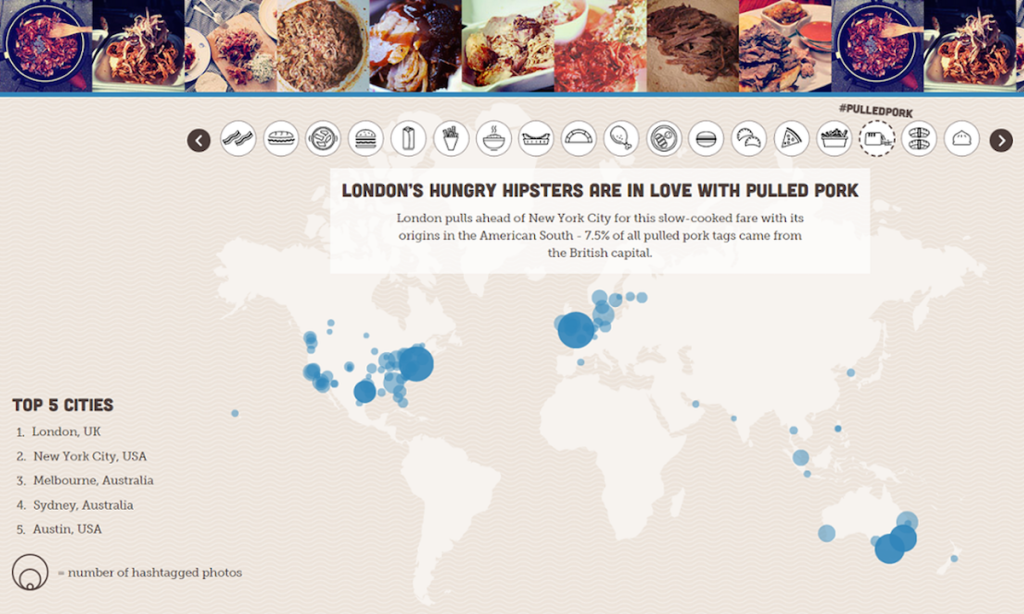
The photo printing company Photoworld has created an interactive map showcasing the food capitals of Instagram. They used the social network’s open Application Program Interface or the API to capture more than 100,000 snaps posted over a week from across the world.
By looking at specific hashtags, the creators of the map were able to see where the biggest fans (or more Instagram posters) of foods such as #bacon, #pizza, #sushi, etc are located.https://instagram.com/p/5J1klCN8bq/?tagged=sushi
So How Does The Map Work?
Photoworld’s interactive foodmap shows percentage data of a particular hashtagged food item via dots. You select the food and the map transforms into an irregularly speckled globe.
On the side you also get a list of the top 5 cities where that particular food is clicked and hashtagged the most. Moreover, you can scroll of the dots to see in detail the data.

Clauses & Drawbacks
This map is merely a representation of food activity on social media and not an actual representation of the food consumed in a particular state, city or country. Basically, it depends on the size of the population active on Instagram.
For example, #pizza tags are more prevalent in New York than in Naples, Rome, Milan and Bologna put together.
Also, some food does not travel so well – all the locations near the top for #currywurst were in Germany, with little mention of it elsewhere.https://instagram.com/p/5JwpR3sryP/?tagged=currywurst


